Ever since the release of Tetris on the Hagenuk MT-2000, mobile games have developed and evolved drastically. We no longer have to squint at tiny screens in order to play games on-the-go. Instead, we now have access to larger, more powerful mobile devices that make for a much more enjoyable experience.
Owing to this, tablets and phones are now taking over the gaming market worldwide, accounting for up 34% of the global games market share in 2015. What’s more, such devices are expected to completely dominate the global video game market in 2020, with an increase of 17% from 2015.

Today in 2019, there are 2.1 billion mobile gamers worldwide—that’s almost a third of the world’s population! Let’s take a closer look at some other mind-blowing mobile gaming statistics.
Mobile Gaming Statistics in 2019
There’s no denying that mobile devices are now more accessible than ever. After all, almost everyone has a mobile phone. So it’s no surprise that smartphones and smartwatches are predicted to take 34% of worldwide overall income in 2019. Despite this fact, according to mobile gaming statistics, around 85% of gamers do not identify as such. This is very surprising considering 30% of those gamers play games daily.

But when you think about it, I guess no one wants to admit they are a mobile gamer—PCMR FTW!
On the topic of PC gaming, 76% of users prefer playing games on mobile devices, whereas 62% prefer to play on PC or Mac. If you’re shocked to hear that, don’t worry, we were too. Below are some additional 2019 mobile gaming statistics:
- Smartphones and tablets took up 34% of the global of the worldwide games market shares in 2015. Today, smartphones and tablets are taking over the global games market
- In 2020, smartphones and tablets are calculated to continue to take over the global gaming market, with a large increase of around 17% from 2015
- As mobile gaming is so popular, 38% of game developers are creating games for smartphones and tablets
- 62% of people download a game onto their phone within a week of purchasing it
- Users spend over 43% of their smartphone time playing mobile games
With all of this in mind, it’s not surprising that 51% of the global games market comes from smartphones with the number being ever-rising.
Mobile Gaming Demographics
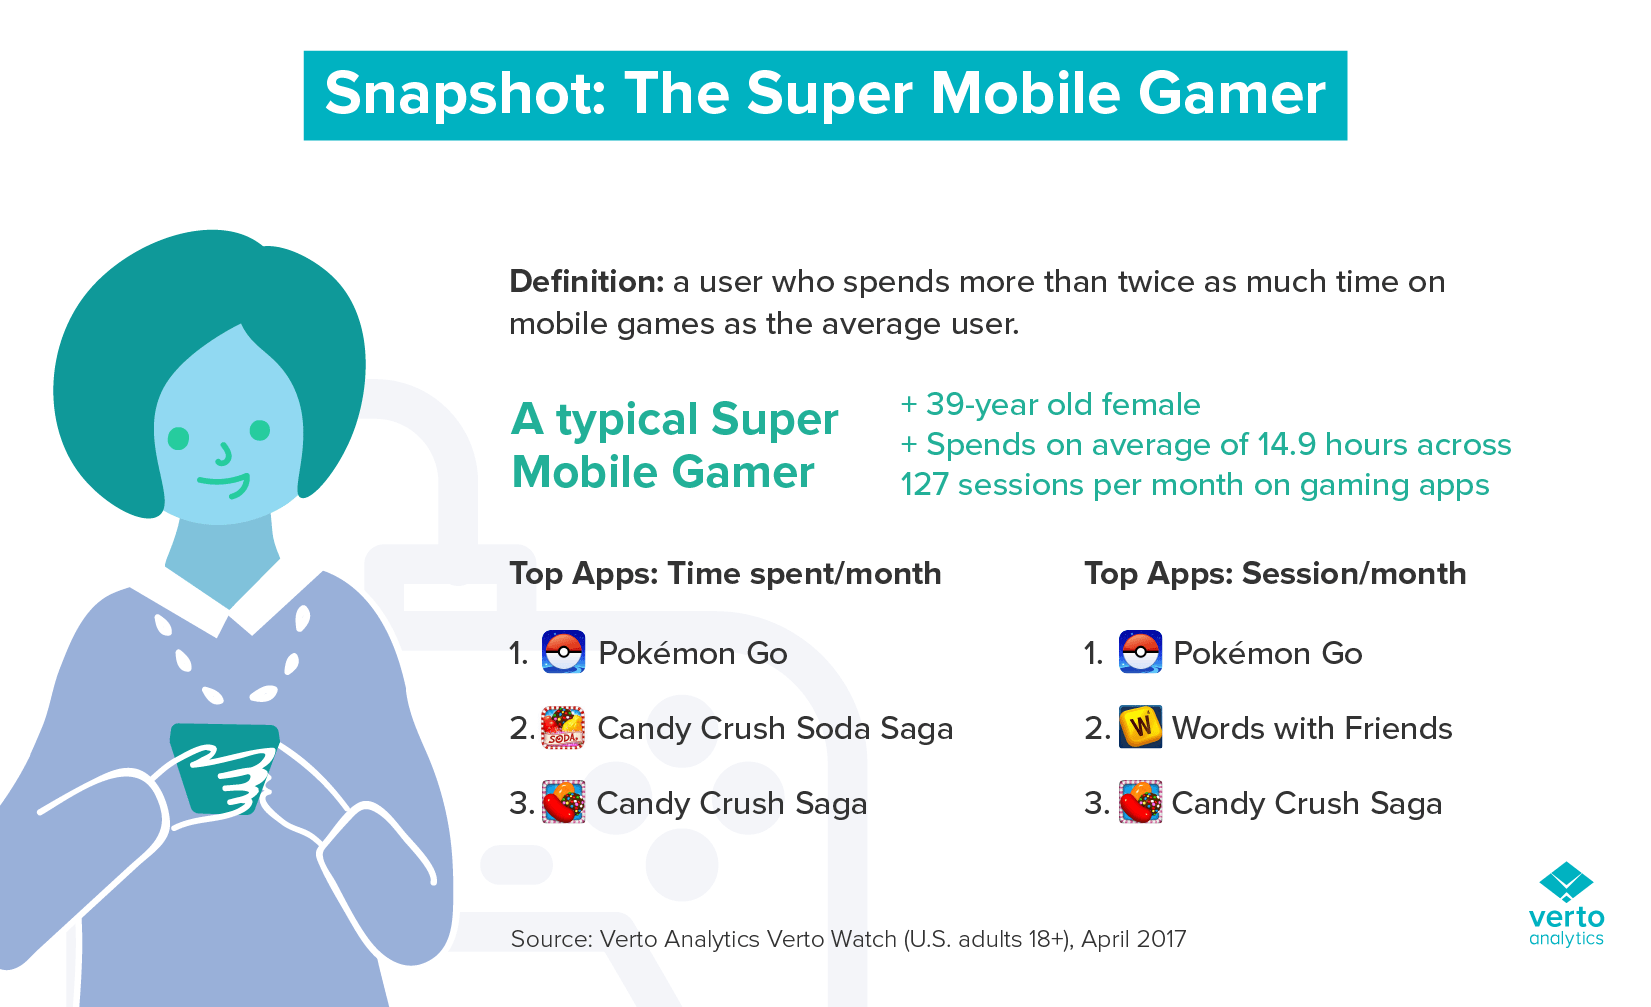
It’s clear that men tend to spend more hours gaming on PC or console, so when we discovered that only 37% of mobile gamers are men, we weren’t necessarily stunned. As this is the case, female mobile gamers are said to be 79% more likely to make an in-app purchase.

But how old are these women?
In 2018, the average age of a female gamer was 36 years old. For the small percentage of male mobile gamers, it was 32 years. Here are some more statistics regarding the demographics that make up mobile gamers:
- 69% of match-3 games were played by women (2017)
- 58% of Candy Crush Saga players were female (2018)
- 65% of U.S. women ages 10 to 65 years old play mobile games
- 55% of mobile gamers are around the age of 55, while only 21% are between the ages of 25 and 34 years old
If you went through overall gaming statistics, you know that males are the majority among the PC and console gamer population.
Mobile Gaming for Children
What do parents tend to do when their child is crying? They give them their smartphone to play on. It’s terrible, but it works a treat. Sure enough, children’s’ free-to-play (F2P) mobile games were estimated to generate around 7.8% more revenue in 2017—a step up from the 317 million U.S. dollars in revenue made in 2016.

In spite of this fact, it is estimated that 60% of children in the U.S. play games on a console.
- Premium children’s games generated 69% of the mobile game industry revenue in the United Stated thanks to upfront purchases
- Premium children’s games generated 30% of the mobile game industry revenue in the United Stated thanks to in-app purchase
- 63% of children in the United States claimed that they play games on a smartphone or tablet
Children’s mobile gaming revenue in the United States is expected to generate 5% more revenue in 2017 from $478 million in revenue made in 2016. This is great for app developers and the market, but it might be frightening for some parents or society in general.
Mobile Gaming US Statistics
Back in 2016, a massive 55.7% of people in the United States were playing mobile games. That number is expected to dramatically grow and reach 63.7% in 2020, a massive increase of 8%. In 2020, it’s expected that 77% of mobile users in the United States will be smartphone gamers.

The gamers in question are said to have currently played an average of around 1.3 games per day and 3.6 games monthly. But that isn’t all; below we have listed some more surprising mobile gaming US statistics:
- In 2015, there were 164.9 million smartphone gamers in the United States
- Mobile gamers played around 1.3 games daily and 3.6 monthly in the United States alone
- 63% of children in the United States have played mobile games
- In the US, mobile gaming penetration is expected to exceed 60%
Some of these stats can be attributed to the fact that people don’t really consider themselves mobile gamers even though they actually are.
Mobile Gaming Stats by Genre
Aside from social media and shopping apps, 50% of mobile app users play games. But what type of games are these users playing? According to Shared2you, casual games are the most popular Android game apps worldwide, with 59% reach among Android mobile device users in September 2017.

Additionally, puzzle games were recorded as the next most popular Android game app, with 57.29% reach among Android mobile device users in September 2017. Since 2017, there’s a 34% increase in revenue from puzzle games, with $3.8 billion. Arcade games account for $1.9 billion and have a 95% increase between 2017 and 2018.
- In July 2016, arcade games had 63.1 million downloads and therefore they are recognized as the most number of mobile game downloads in the United States
- In July 2016, action games come in at second place among the most number of mobile game downloads (61.5 million) in the United States
- Puzzle, board games, card games, and game shows are among the most popular mobile games that are often played by gamers in the U.S.
- Arcade games had the most monthly active users (MAU) in July of 2016, reaching 80.7 million, followed by puzzle and adventure games with an MAU count of 54.5 million 69.8 million individually
- The global revenue of brain and strategy mobile games is expected to grow by around 49% in 2022 from the $6.7 million revenue made in 2016
Not shockingly, the worldwide revenue of action and adventure mobile games is expected to grow by around 46% in 2023 from the $5.6 million in revenue made in 2016.
Mobile Gaming vs. Other Platforms
The great thing about smartphones is that thanks to unlimited data plans, you can game on-the-go. The thing is, PC and console games tend to be much better than the ones available on mobile devices.

As such, 39% of consumers of consoles said that they would most definitely play mobile versions of PlayStation 4 games if they were made available. While 35.5% of Xbox One consumers said they would likely play mobile versions of games on Xbox if they were made available.
Mobile Gaming Seller Stats
According to a report by Statista, 22% of gamers in the United States purchased video games through the digital video game platform, Steam. This makes sense considering Steam is one of the most popular video game distribution platforms going.
Simultaneously, many gamers prefer to purchase digital copies to put on display, which is why 43% of gamers in the United States said they purchased games on online retailers like Amazon and eBay.
A whopping 56% of gamers in the U.S. purchased video games through the App Store and Google Play Store.
Mobile Gaming: Android Statistics
Regardless of what Apple fanboys say, Android is the world’s largest operating system going. Sure enough, 78% of the players across the globe belong to the android game markets. Ever since 2016, Android has the larger part of the marketing share. Surprisingly, Android sales are rising in the United States, Europe, India, and Japan, but not in China.
In fact, China is the only place in the world where Android’s sales are declining.
- 21% of the Android apps downloaded are mobile games
- In 2010, Android had less than 5% of the market share globally
- As of 2018, 30% of the U.S. market belongs to Samsung—making it Android’s biggest partner. In March 2017, its share of all know devices was 37.93%
- As of 2018, Samsung is the leader of Android’s band with 30% of the market in the United States
- Android had 88% of the global market share in 2016
- In 2017, the Android market share fell down to 74%
- 58% of Android games use adverts as a monetization model. Since December 2016, it is the most popular type of monetization model
As of March 2018, Texas Holdem Poker has the most number of fans with a whopping 65.35 million fans making it the most popular mobile game on Facebook. It’s a funny stat with some possible correlation to the consideration of how most of the online gambling is performed from mobile devices.
- As of December 2016, 58% of games on Google Play use adverts as a monetization model
- In December 2016, 22% of Android games were not monetized
- In December 2016, 15% of Android games used in-app purchases as a monetization model
- As of September 2017, 6.96% of Android games use paid apps as a mobile gaming monetization method
- As of September 2017, 21.5% of Android gaming applications contain in-app purchases and have used it as a mobile gaming app monetization method ever since
- Subway Surfers was the first game to get over a billion downloads in the Google Play Store
- As of August 2016, 54% of Android top-grossing games contain in-app ads
- As of August 2016, 46% of Android top-grossing games do not contain in-game ads
Finally, it’s intriguing that since September 2017, 70.7% of Android gaming applications contain adverts and therefore it is the most popular method of mobile gaming app monetization used by mobile apps across the globe.
Mobile Gaming: iPhone Statistics
Even though Android is the world’s largest operating system, Apple device users tend to spend far more money on in-app purchases. As of May 2016, iOS device owners spent an average of $10.96 on in-app gaming purchases monthly, compared to 5.53 U.S. dollars spent by Android device owners. With that said, 11.4% of iOS gaming apps contain in-app purchases and use it as a mobile gaming app monetization method as of September 2017.

When it comes to in-game ads, 59% of iOS top-grossing games contain in-app ads as of August 2016. While 41% of iOS top-grossing games don’t contain ads.
- 25% of iOS apps downloaded are mobile games
- The mobile version of Fortnite has generated over $455 million in revenue
- When Fortnite Mobile was released back in 2018, 28% of iOS Fortnite gamers were female
- Netflix is currently sitting on the throne among the list of iOS applications & games topping both the downloads and revenue charts
- Pandora Music takes the #2 place looking at the list of iOS games and apps with the most revenue and downloads
- YouTube sits at third place among the list of iOS apps and games with the most revenue and downloads
In 2017, the App Store had a gross mobile games revenue of $8 billion compared to Google Play’s $4.5 billion gross by mobile games in the same quarter and year.
Mobile Gaming Revenues
The fact that Fortnite is the top-grossing iPhone mobile gaming app in the U.S. as of April 2018 should come as no surprise. The mobile version of the popular battle royale game has since generated a daily revenue of 1.92 million U.S dollars. That’s 32% more daily revenue than Candy Crush Saga as of April 2018.
In 2017—a year before Fortnite mobile was announced for Android and iOS—the market value of mobile gaming content over the globe is $59.8 billion and is projected to reach a whopping $74.4 billion this year (2019).

Certain advancements such as higher-quality graphics and unlimited data plans make for more engaging gameplay, which is why more people are starting to game on their smartphones. In 2020, the number of smartphone gamers in the United States is set to grow by 9% from the 2017 record of 192.2 million mobile phone gamers.
The success of mobile gaming means that the industry will continue to increase revenue.
- The United States is one of the top countries for smartphone game session stocks, taking up almost 20% of the total market; following the U.S comes India with 13% shares
- The number of gamers preferring mobile phone in the US is presumed to grow by nine percent in 2020 from 2017’s record of 192.2 million mobile game lovers
- In the United States, 72.3% of mobile users are mobile phone gamers
- Mobile gaming proceeds reached an enormous 16.6 billion euros in 2017 and is estimated to create 26.3% more in 2021
- Tablet gaming revenue will presumably increase by 42.3% more in 2021. That’s a gigantic move up from the 6 billion sold in 2017
- In 2020, the revenue of game-applications is said to increase by 44% from the 41.5 billion U.S. dollar revenue in 2016
- In 2016, 8.9% of the mobile download and in-app revenues in 2016 was covered by video downloads
- In 2016, smartphone gamers in the United States who played Game of War – Fire Age (MMO Strategy) spent an average of $335 on in-game purchases.
- Mobile gamers in the United States who enjoyed the Mobile Strike game spent around about $310 on microtransactions (average per player)
- In the United States, mobile games were estimated to generate the most revenue in the digital games industry, making up 39.9% of global shares
- After Chine, the United States is the second-largest gaming market with $25.426 billion in revenue
- Asia was a leader in the mobile gaming market with a revenue of 41.5 billion U.S. dollars
- 2.4 billion gamers around the world spent137.9 billion U.S. dollars on games
Freemium/Paid Mobile Game Stats
We can probably all agree that we would rather deal with adverts than pay for a mobile game. According to Statista, only 21% of U.S. gamers who own tablets and smartphones have 1 to 2 paid games on their devices. Since around 92% of the games available on Google Play are free to download games, it’s no wonder 79% of gamers don’t have paid apps on their smartphones.
Another interesting fact is that demographics are a huge part impacting the statistics when it comes to paying for in-app merch:

However, many free games are actually freemium titles since they tend to be more profitable, but why? The below freemium and paid mobile game statistics may answer that very question.
64% of the freemium gamers are said to have made at least one in-game purchase
6.5% of gamers enjoying freemium titles admitted to making five or more in-app transactions
23% of games on the Google Play Store that you can download for free use in-app purchases as a monetization model
23% of games that are available on Google Play used in-app purchases as a monetization model
6.5% of mobile gamers enjoying freemium titles stated that they have bought more than 5 goodies in their game of choice
As of February 2016, 19% of users who spend time playing freemium titles have claimed that they made at least 2 in-app transactions
54% of mobile gamers around the globe said they tend to watch the video adverts if the said ads give them in-game goodies
92% of games you can download on the Google Play Store are free and only 8% are paid.
30% of U.S. gamers said they don’t own any paid games on their tablets and their smartphones
23% of gamers in the U.S. stated that they have about 3 to 5 paid games on their smartphones and tablets
The game which is averaging the highest among gamers in the U.S. which spend money on in-game purchases is Game of War – Fire Age. Personally, I was surprised with this info as I know of games more popular. Still, GoW: FA is the champ with an average of 336 U.S. dollars spent annually.
Mobile Gaming Marketing and Developers
As there are thousands of active games companies submitting hundreds of mobile games to the App Store every single day, competition is extremely high. As of Fall 2017, it’s said that 73.1% of game devs view competition as the biggest threat to their mobile games business. In the same year, 47.5% of game developers view rising marketing costs as one of the main threats to the mobile game industry.

The rising UA costs as of Fall 2017 is also recognized as one of the largest threats to their mobile games business according to 63.2% of game developers worldwide
While the growing audiences offer mobile gaming advertisers with huge opportunities, reaching those users is another story. Many gaming brands are even turning to influencer marketing to drive downloads, which in turn, will raise brand awareness. So, how are the leading video game publishers that specialize in the mobile games market doing today?
- With 4.9 million downloads in January of 2018, Voodoo surpassed all of the other publishers in the iPad gaming app with the most downloads
- With 4.35 million downloads, Ketchapp made its way to second place worldwide regarding mobile gaming downloads on iPad
- In January 2019, Ketchapp had 24.07 million downloads, making it the leading iPhone gaming app publisher globally
- Ketchapp had an estimate of around 20k more downloads than Voodoo had in January 2018, winning the title as the leading iPhone gaming app publisher worldwide
- As of January 2018, King was the top publisher globally claiming a stunning revenue of $41.52m
- In January 2018, King made 48% more profit in comparison to Tencent Mobile Games
- By making a global revenue of $87.56 million in January 2018, King made its way as the top mobile gaming app publisher in Google’s Play Store with the most revenue
- By generating $236.57 million worth of revenue in January 2018, Tencent Mobile Games was the highest-earning publisher when it comes to iPhone games; also, the one with the largest earnings globally.
- After it generated $99.98 million back in January 2018, NetEase Games took second place among the leading iPhone gaming app publishers with the most revenue globally
- Taking the runner-up spot among the top application publishers in January 2018 with the most revenue is Supercell. Following Supercell is BANDAI NAMCO Entertainment Inc, claiming a huge $338.94 million in revenue
- In 2018, ELECTRONIC ARTS (EA) was the most popular publisher with the highest number of downloads (25.02m)
- In January 2018, Outfit7 managed to make its way to second place in the top-earning mobile game developers in Google’s Play Store with 24.31 million downloads worldwide
As you can see, the most popular publishers are the most successful ones but there are some less-known underdogs clawing their way up the ladder.
Mobile Gaming Promotion and Ads
Reports show that 29% of game developers view app store promotion as the most significant when it comes to expanding their game audience. As we tend to spend our time looking down at our smartphones, 2.9% of game developers view traditional display ads as the least important method for growing their game audience.

Still, the stats don’t lie as we can see below:
- The mobile app store covered 35.6% of the worldwide app store and in-app advertising revenues of mobile applications and games
- In the first half of 2017, Google’s AdMob was the most used software development kit (SDK), taking up 46.04% of gaming applications
- Chartboost was the second most used software development kit (SDK) in Android games in 1st half of 2017, covering 34.37% of gaming apps
- In the first half of 2017, Unity ADS comes in 3rd on the list of the most used software development kit (SDK), covering 23.48% of gaming applications
- From January to November 2017, 79% of ad formats are banners, making them the highest share of in-app impressions from around the world
- From January to November 2017, 14% of ad formats are rich interstitial, taking second place among the highest share of in-app impressions globally
- 67% of games on the Google Play Store that you can download for free use ads as a monetization model
In the end, in-app mobile advertising covered 30% of the worldwide in-app advertising and app store revenues of mobile games and applications.
Final Words
Now that smartphones boast faster processing speeds, higher-quality graphics, and larger screens, it’s no wonder smartphones and tablets are taking over the global games market. The growing success of the industry is also attracting new audiences, old and young, which is why the market value of the global mobile content is in the billions.
Since hundreds of apps are submitted to the App Store and Google Play Store each and every day, finding the right game can be a daunting task. Luckily, we have created a list of some of the best iOS games for 2019. This way, you won’t waste your time or your money on a game you’ll play once.
Sources (Images & Data):
- Top Games, Apps, Publishers of 2018, Sensortower
- Verto Analytics Mobile Game Report, Verto Analytics
- Newzoo Global Gaming Market Report, Newzoo
- Mobile Game Statistics, Statista